Datasets
This page contains summary export data used in the preparation of the 2018 Delta Consumptive Water Use Study Report.
There are three primary types of data linked here:
- Spatial (12-band raster) data for monthly model estimates of evapotranspiration (ET). Bands represent months of the water year, starting with October. Units in 10th mm/day.
- Spatial (12-band raster) data for monthly model estimates of ETo. Bands represent months of the water year, starting with October. Units in 10th mm.
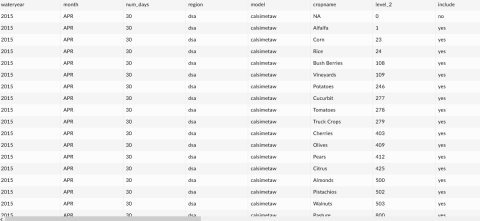
- Tabular summaries of the spatial data processed in Google Earth Engine, used to create report figures.
In addition, we expect to add land use and field data in the near future.
Each model's ETa is included in this folder, but not all models had their own ETo. Most used the included Spatial CIMIS ETo
for the purposes of this study. In the case of DisALEXI, ETo is a derived product from the model, and it is included here.
Most models produced estimates of evapotranspiration either daily or on the dates that Landsat passed over the study area.
In this study, monthly data were compiled when daily or Landsat overpass date data were provided.
CalSIMETAW
DETAW
- 2015 12-band monthly ETa raster
- 2016 12-band monthly ETa raster
- 2015 12-band monthly ETo raster
- 2016 12-band monthly ETo raster
DisALEXI
- 2015 12-band monthly ETa raster
- 2016 12-band monthly ETa raster
- 2015 12-band monthly ETo raster
- 2016 12-band monthly ETo raster
ITRC-METRIC
SIMS
UCD-METRIC
UCD-PT
Processed Model Data in Tabular Form
Boundaries
Spatial CIMIS Reference Data
Field Data (Link to Box folder)
- 2015 daily data and station information (zip)
- 2016 daily data and station information (zip)
- 2016 half-hourly data and station information (zip)
Land Use Data
The land use data used for this project was provided by LandIQ. Those interested in utilizing this data should contact LandIQ directly, or the California Department of Water Resources, which is responsible for the release of this dataset in relation to this project. Our contract does not allow us to release LandIQ data ourselves.
Code for graphs and figures
The code for generating graphs and creating map figures in the report is available on GitHub in two repositories:
- ssj-graphs-r - generates figures from Earth Engine exports. Information on how to use it is in the README.
- ssj-data-viz - used to compare models spatially and create figures showing the variance between models in 2015 and 2016.
- ssj-earth-engine - Code involved in the processing of the input data into the monthly rasters and the generation of the tabular data
Questions on the code or data should be directed to Nick Santos at the Center for Watershed Sciences

